
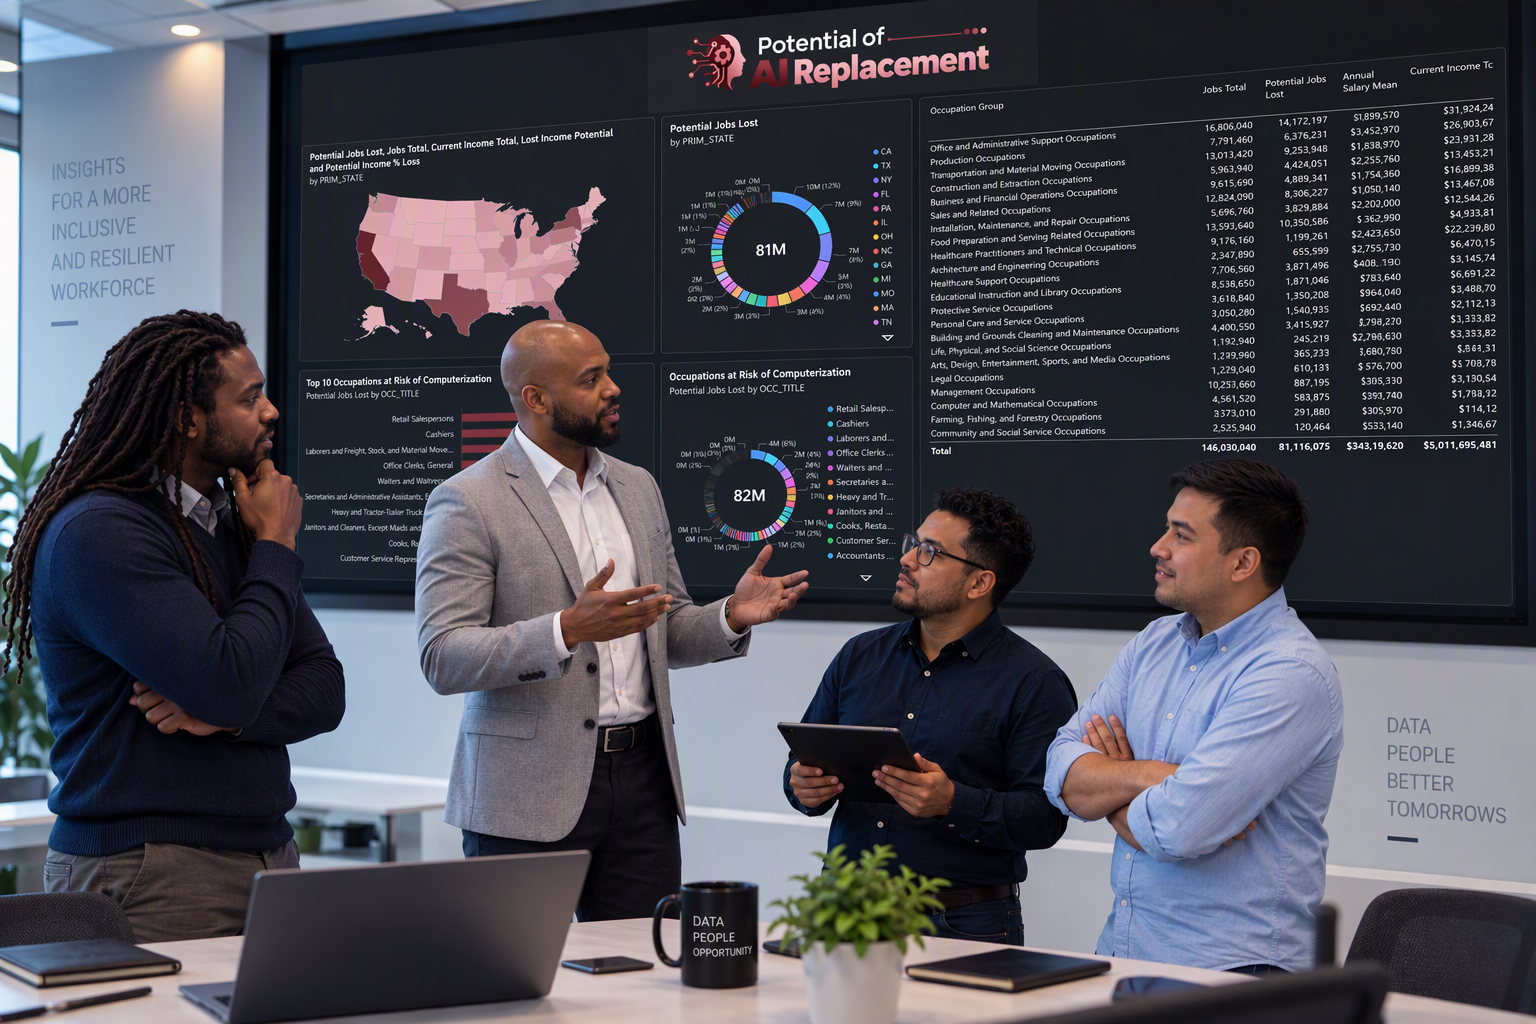
This study began with the first step of the exploratory data analysis process: asking questions and considering what our data skills could help us uncover. As a group, we agreed to focus on a topic highly relevant to today’s workforce: how artificial intelligence and automation may affect jobs across the United States. From there, we planned how to carry out the study by identifying the right data sources, exploring and cleaning the data, applying Frey and Osborne’s (2013) computerization probabilities to 2025 Bureau of Labor Statistics employment and wage data, and building interactive Power BI dashboards for in-depth analysis. This multistep process produced the final products you see here: our website, report, video, and data visualizations.






Our Data Sources
• Bureau of Labor Statistics. (n.d.). Occupational employment and wage statistics tables. U.S. Department of Labor. https://www.bls.gov/oes/tables.htm
• Bureau of Labor Statistics. (n.d.). Occupational requirements survey database. U.S. Department of Labor. https://www.bls.gov/ors/data.htm
• Bureau of Labor Statistics. (n.d.). 2018 standard occupational classification system. U.S. Department of Labor. https://www.bls.gov/soc/2018/
• Frey, C. B., & Osborne, M. A. (2013). The future of employment: How susceptible are jobs to computerisation? Oxford Martin School, University of Oxford. https://www.oxfordmartin.ox.ac.uk/downloads/academic/The_Future_of_Employment.pdf
• National Center for O*NET Development. (n.d.). O*NET database. https://www.onetcenter.org/database.html
• U.S. Census Bureau. (n.d.). American Community Survey data. https://www.census.gov/programs-surveys/acs/data.html
• U.S. Bureau of Labor Statistics. (2017, December 6). Crosswalks between the 2018 SOC and systems used by other federal and international statistical agencies. https://www.bls.gov/soc/2018/crosswalks.htm
But wait there's more.......
With our data obtained, cleaned, transformed, and visualized, we can move on to the analysis. It reveals which industries and occupations are most at risk, which regions of the U.S. could see the greatest impact, and the overall picture of how AI automation may disrupt the workforce. Click the button below to see what we found.Below, we also give a quick overview of how we built this website with WordPress and edited our video in Adobe Premiere Pro.